

Widget polarAreaChart
A polar area chart is a circular graphics, divided into slices which have equal angles, but differ in how far each of them extends from the center of the circle, in order to illustrate numerical proportion.
The “widget_polarAreaChart_” configuration have the following parameters:
|
Configuration |
Description |
|---|---|
|
dataset |
Defines the settings for each chart slice in JSON object format |
|
interval |
Specifies how many intervals and the type of interval shall be displayed |
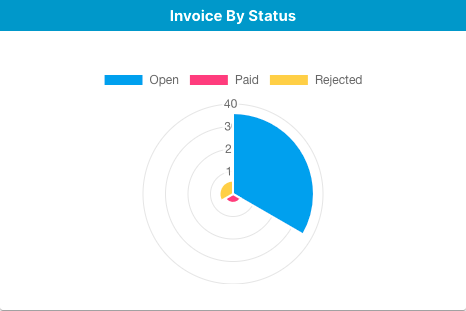
EveryDataStore implements one widget of this type, called “Invoice By Status”. This widget graphically represents data about “Invoice” RecordSet items, i.e., items of the “Invoices” database.
Chart has three different slices with following names: Open, Paid and Rejected. Moreover, it differentiates RecordSet items by their “Status” value, so that each slice corresponds to a set of RecordSet items with a certain value in “Status” field:
|
Open |
RecordSetItems where the “Status” field has the value “Created” |
|---|---|
|
Paid |
RecordSetItems where the “Status” field has the value “Paid” |
|
Cancelled |
RecordSetItems where the “Status” field has the value “Cancelled” |
The “Invoice By Status” widget of this type has the following configurations:
|
parameter |
Description |
|---|---|
|
dataset |
Defines the settings for each chart slice in JSON object format; JSON key-value pairs are explained in the table below |
|
interval |
Defines a 6 months interval |
Note: “_invoice_status” part of configuration name is user defined. Users may change this part by different word or definition, and then add desired value to the configuration to create new widget.
The “widget_polarAreaChart_dataset_invoice_summary” contains following settings for each slice:
|
Parameter |
Description |
|---|---|
|
name |
Name of the chart slice; visible in the legend as well as on hover |
|
dataSrcSlug |
Unique identification number of the “Invoice” RecordSet |
|
dataType |
Data type of the source |
|
fieldSlug |
Unique identification number of the “Status” field in the “Invoice” RecordSet |
|
fieldValue |
Specifies the value for the “Status” field |
|
backgroundColor |
Specifies the background color for the slice in chart RGB color code |
|
countOption |
Specifies the applied function to the field defined in “fieldSlug” |
The “Invoice By Status” widget of type “polarAreaChart” is the fourth widget in order on “Dashboard”.
Configuration example.
{
"dataset":[
{
"name":"Open",
"dataSrcSlug":"9ba63e279c84ef629ba2",
"dataType":"RecordSet",
"fields": ["0ac26f0d01b9c54f6f2a"],
"filter": {"Value" : ["Created"]},
"backgroundColor":"rgb(54, 162, 235)",
"borderColor":"#FFA726",
"countOption":"count"
},
{
"name":"Paid",
"dataSrcSlug":"9ba63e279c84ef629ba2",
"dataType":"RecordSet",
"fields": ["0ac26f0d01b9c54f6f2a"],
"filter": {"Value" : ["Paid"]},
"backgroundColor":"rgb(255, 99, 132)",
"borderColor":"#42A5F5",
"countOption":"count"
},
{
"name":"Cancelled",
"dataSrcSlug":"9ba63e279c84ef629ba2",
"dataType":"RecordSet",
"fields": ["0ac26f0d01b9c54f6f2a"],
"filter": {"Value" : ["Cancelled"]},
"backgroundColor":"rgb(255, 205, 86)",
"borderColor":"#ff3300",
"countOption":"count"
}
],
"interval":
{
"interval":"6",
"intervalType":"month"
}
}


